Started Oct 26, 2026
Orange County crash hotspots
Where do injury and fatal crashes show up in Orange County, and what would I need before calling any place a hotspot?
In progress. Sample output can be shown. It is not a finished study, and listed tools are not claimed skills.
Python · pandas · matplotlib
Data
The starter script downloads one year of points from a public ArcGIS layer, OCTraffic_Crashes. The layer description says the points come from CHP SWITRS through UC Berkeley’s TIMS. It keeps crashes that have coordinates. It does not include property-damage-only crashes.
The sample run uses 2024. That is a filter on this layer, not an official CHP annual total.
Approach
Clean the rows, drop anything without coordinates, and chart raw counts. The comments in projects/oc-crash-dashboard/analyze_crashes.py explain each step. This starter is Python. QGIS and AutoCAD are not part of it, and I am still learning those tools.
Result
In progress. The figures below are sample output from the starter script for 2024. They are not a safety study. Counts are not adjusted for how much traffic a city has, so a tall bar is not a ranking.
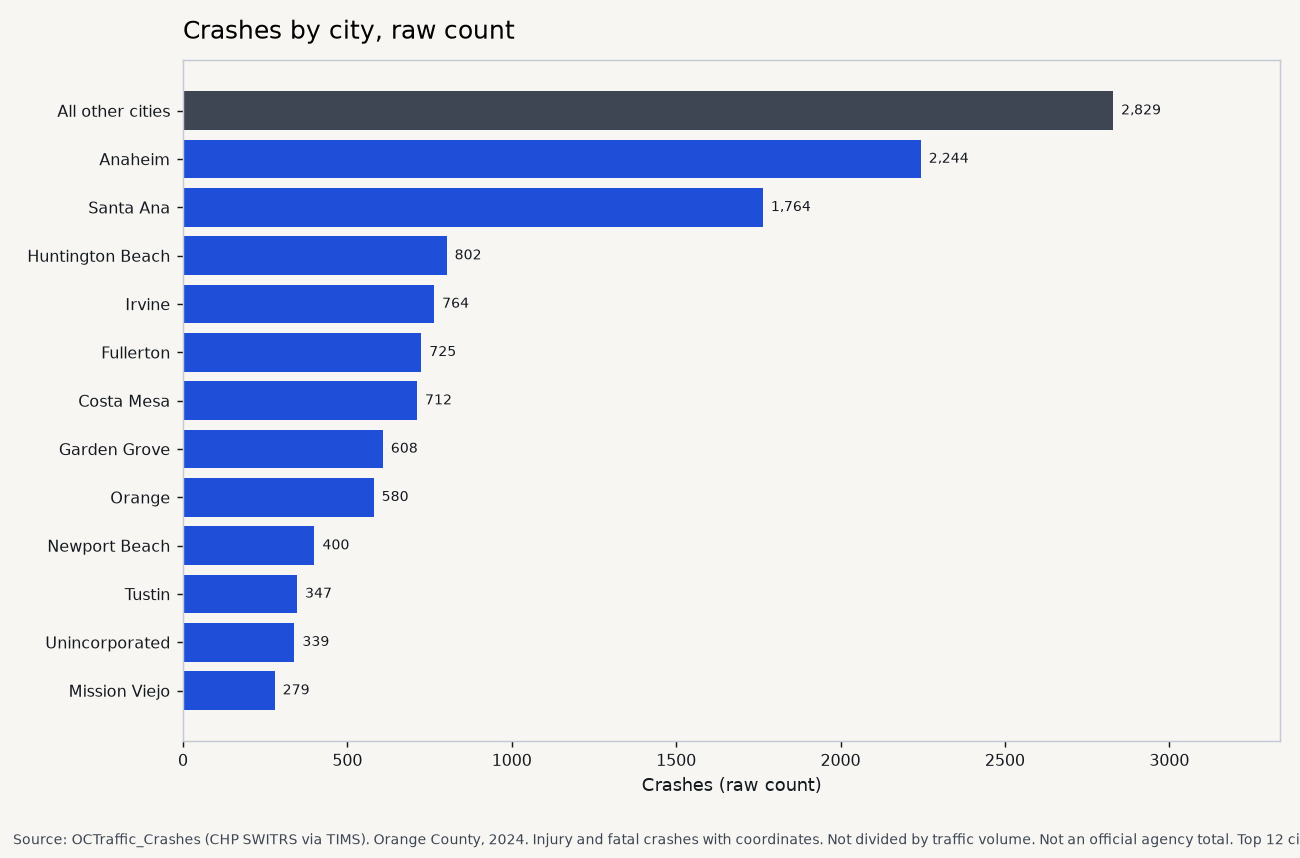
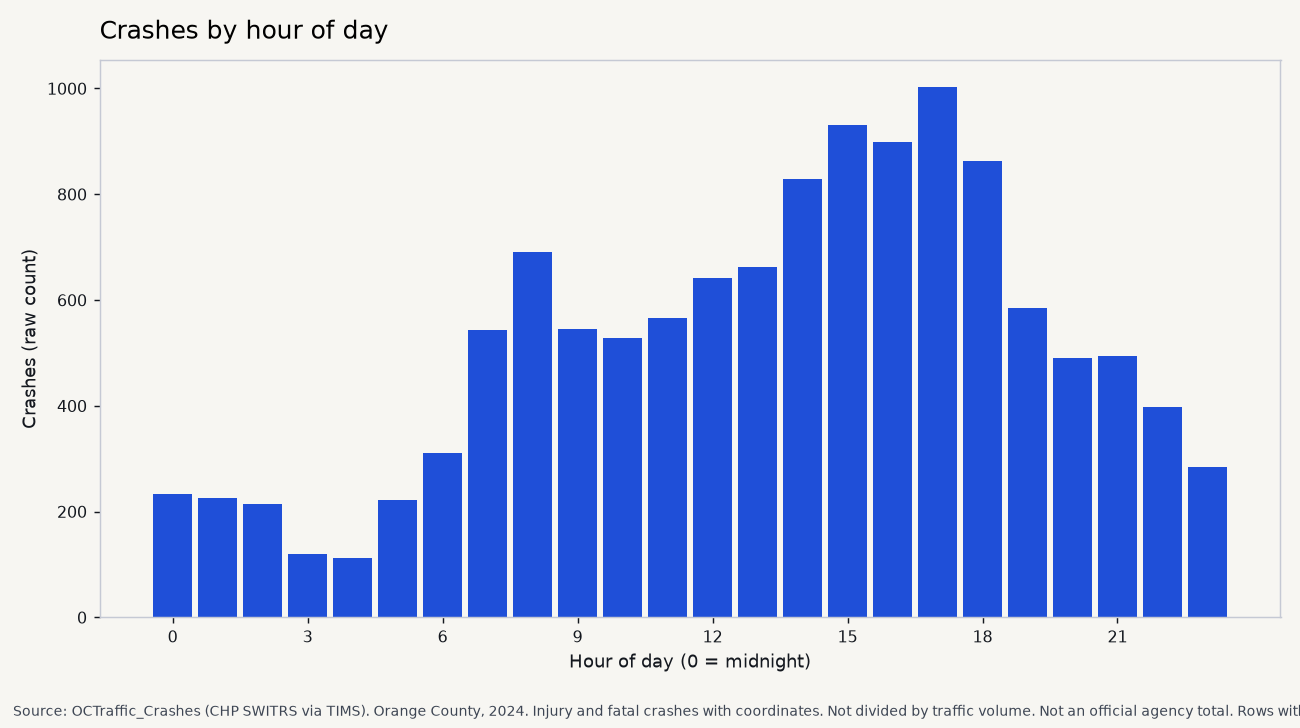
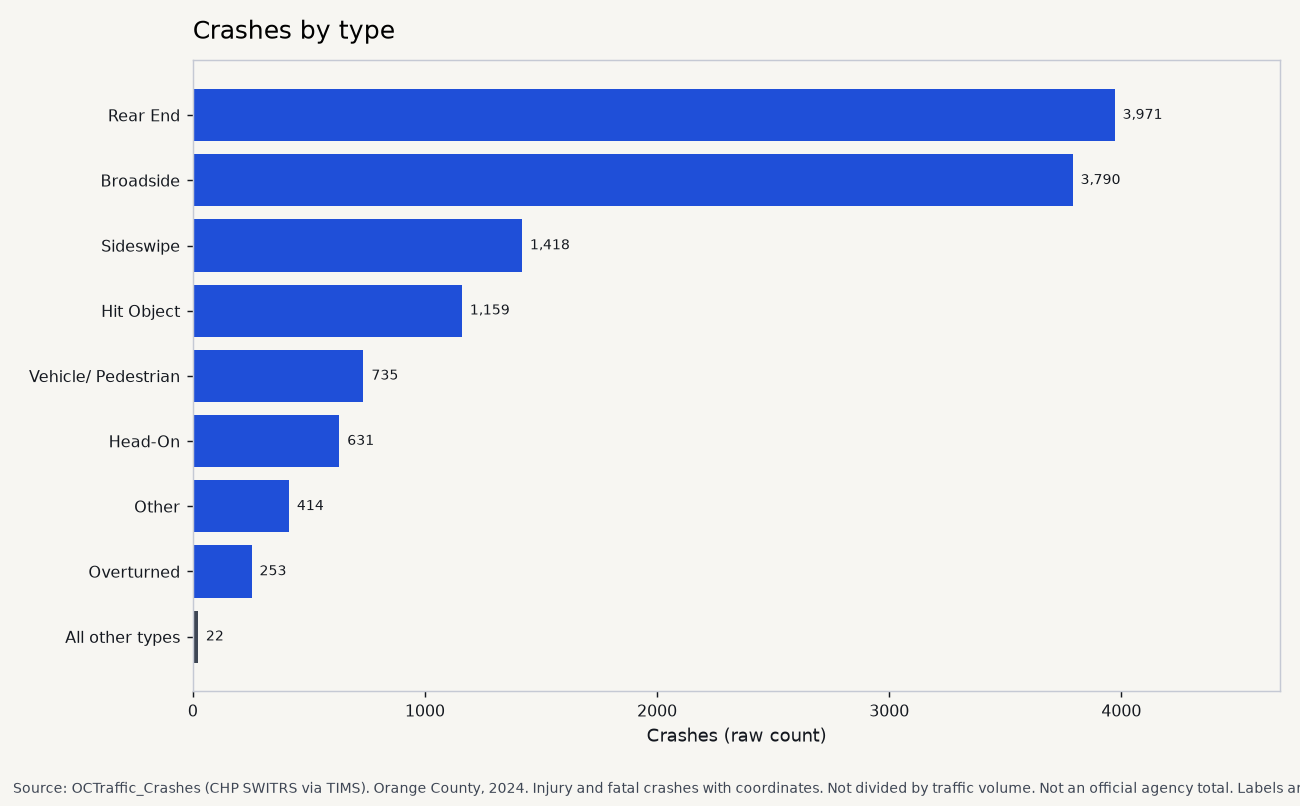
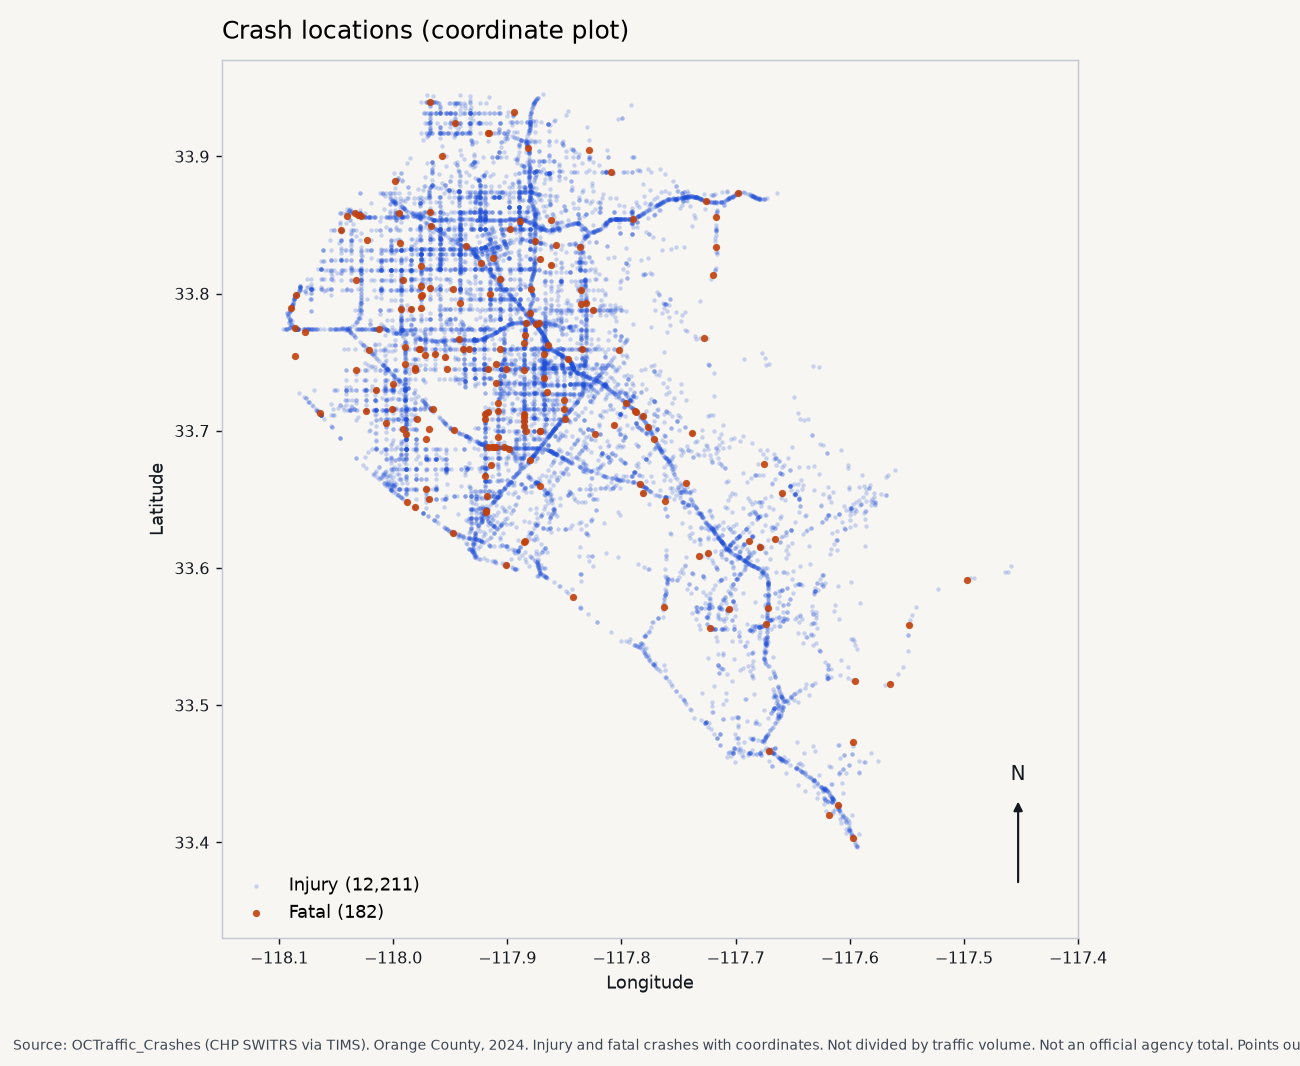
- In this repo: projects/oc-crash-dashboard